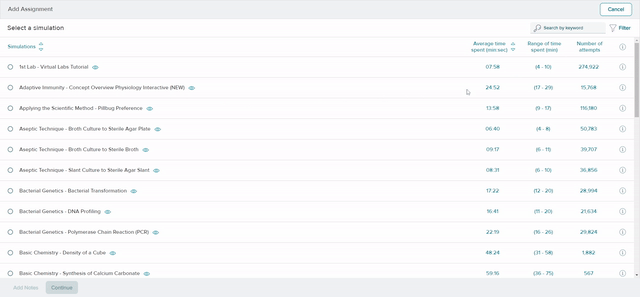
McGraw Hill Virtual Labs now allows instructors to see the average time spent on each simulation and the range of time spent. Average time is based on students' first attempt completions in the past 12 months and is displayed in minutes: seconds.
Range of time spent is between the lower and upper quartiles (Q1 - Q3). This range represents the time spent for 50% of students with a completed attempt.
The number of attempts column is the number of students who have completed this simulation to 100% in the past 12 months.
Instructors can sort by average time spent column then sort back to an alphabetical list under the Simulations column.